
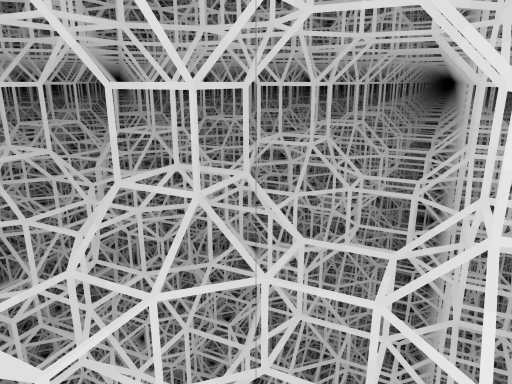
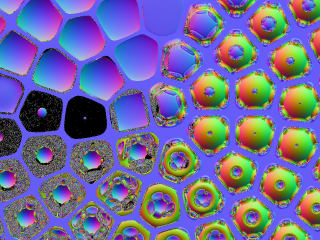
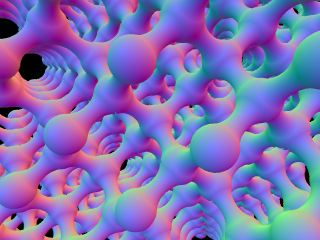
Newest first. Most of the older images were made with PoV-Ray. Source code is available.
The captions are not as clear as they might be – not because the concepts (though sometimes obscure) are hard, but because I think about them mostly nonverbally. Please tell me if the text is puzzling.
You can buy solid objects designed by me; a few pix.
I have contributed some illustrations to Wikipedia.
If you use one of my images on Myspace or whatever, it would be polite to tell me that you're doing it!
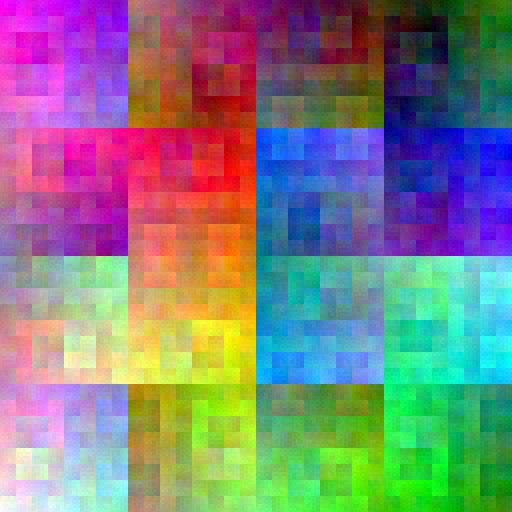
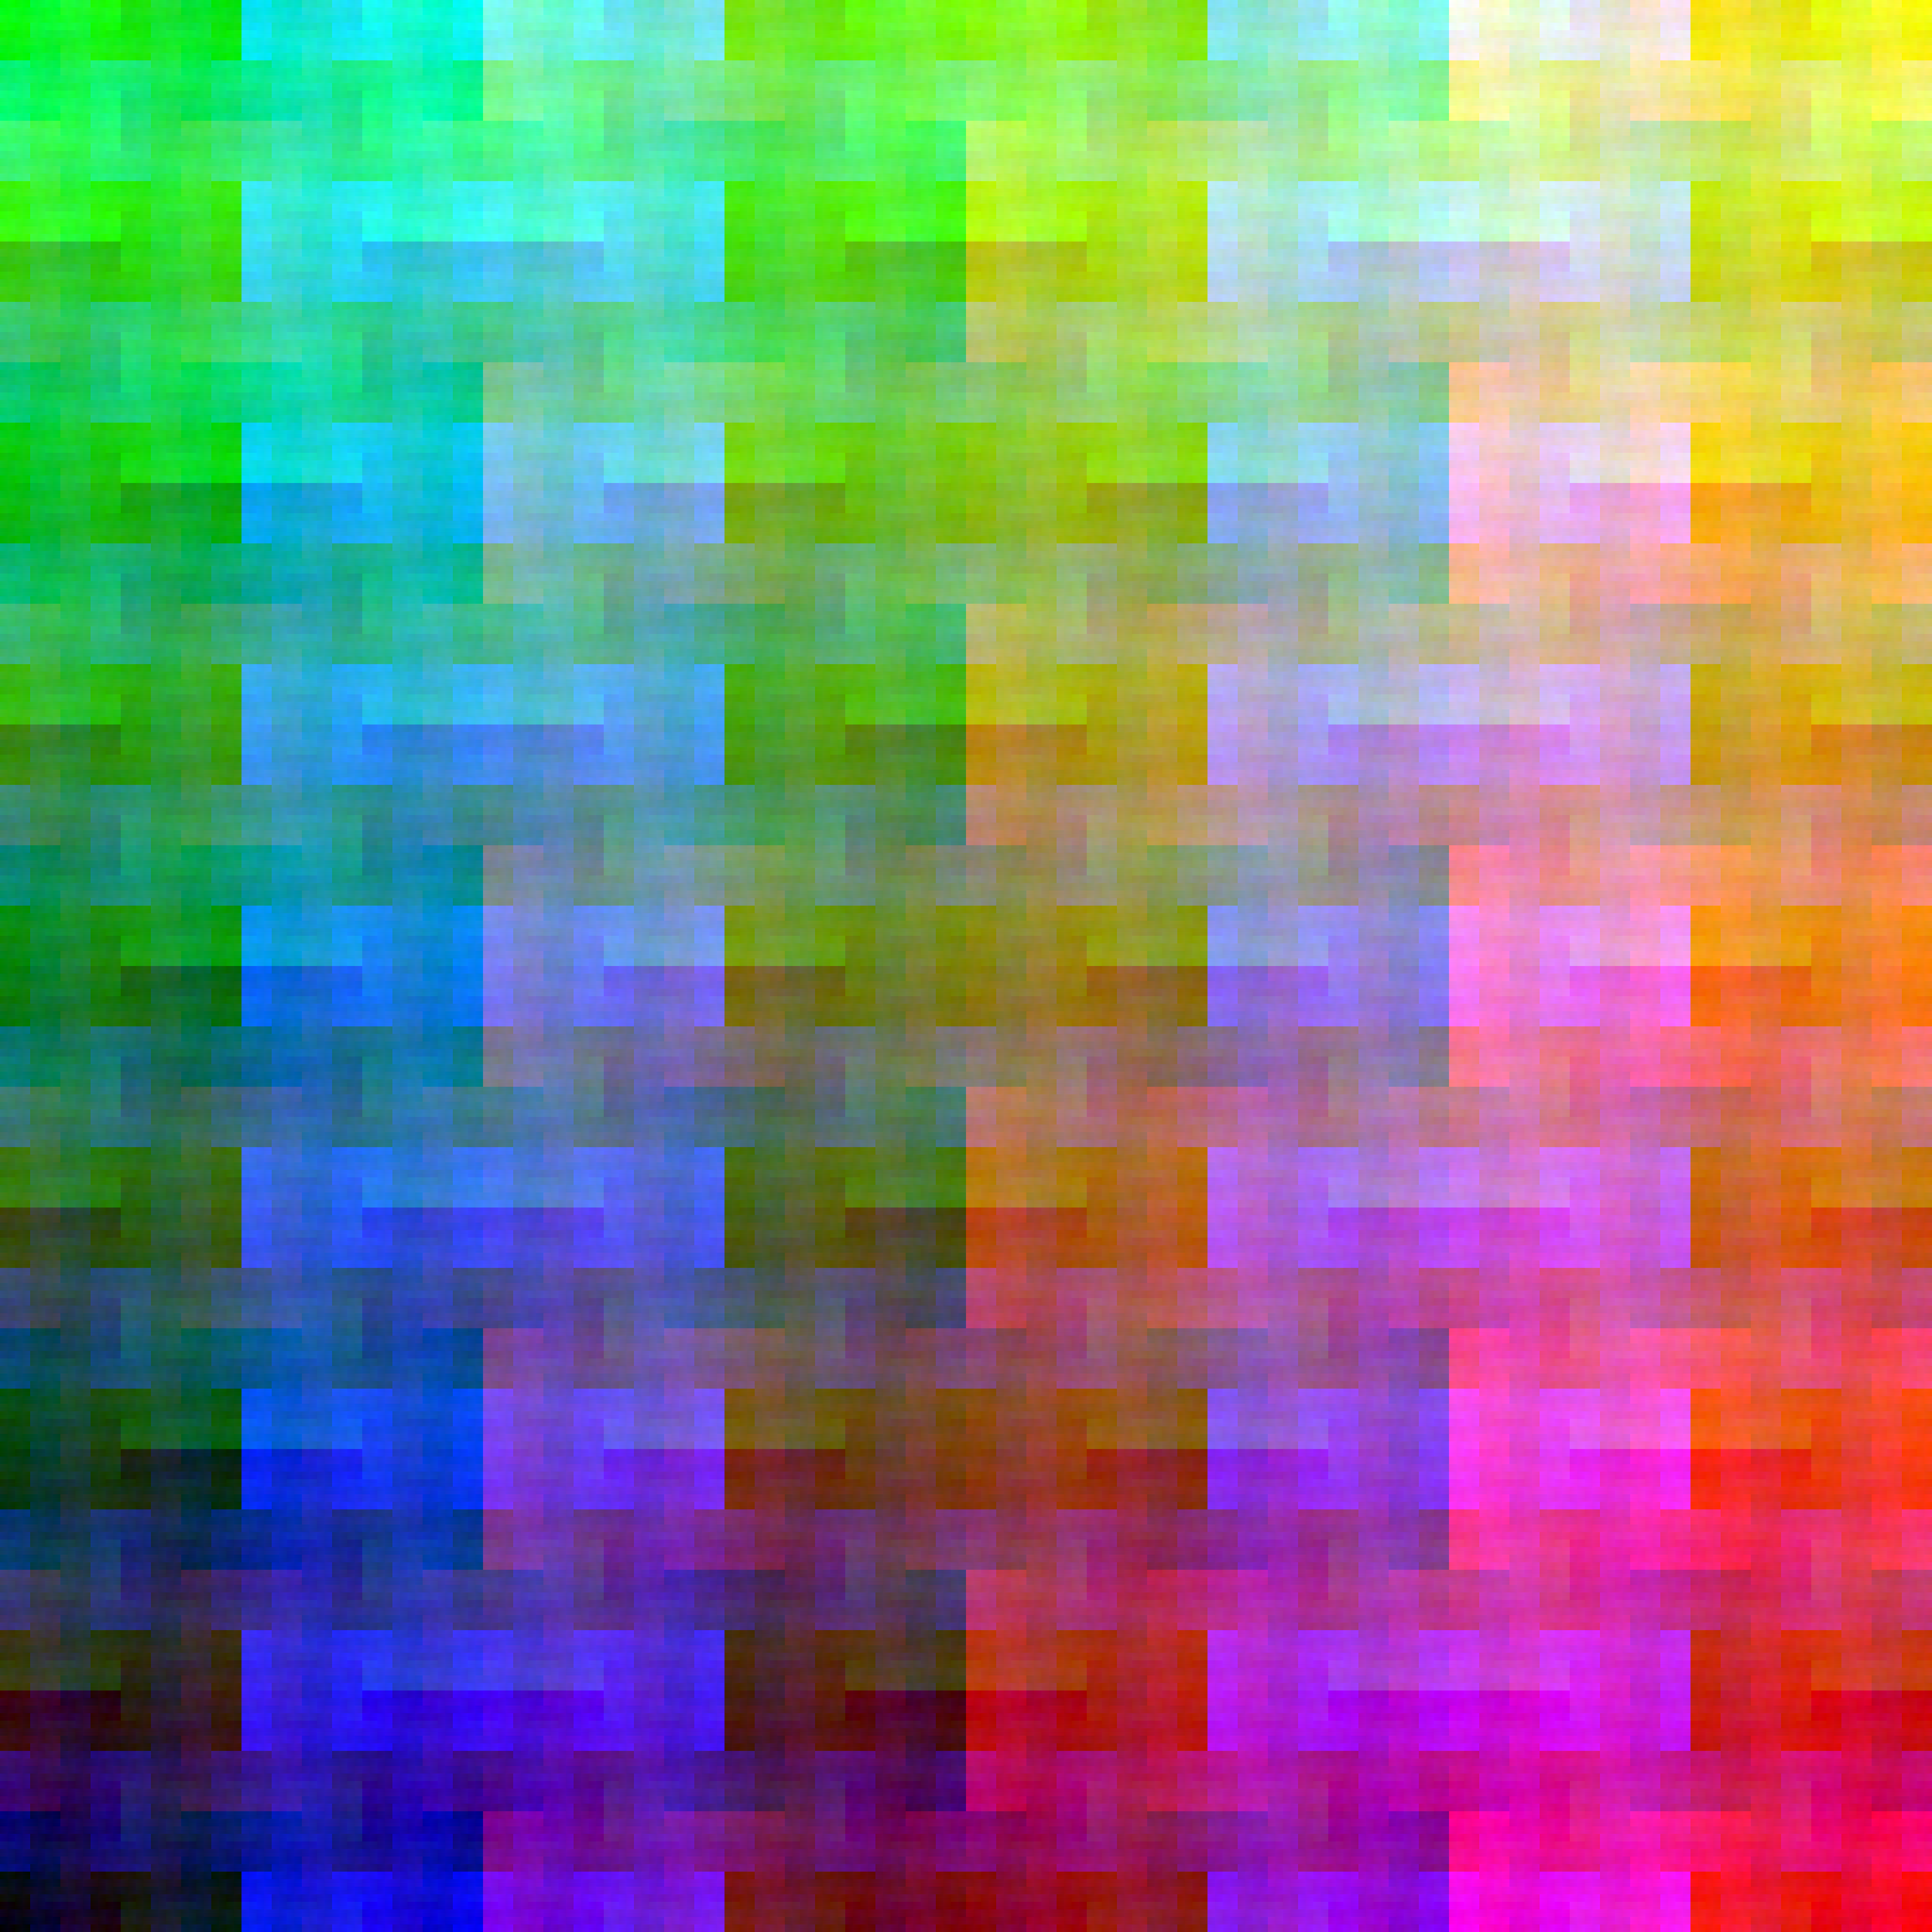
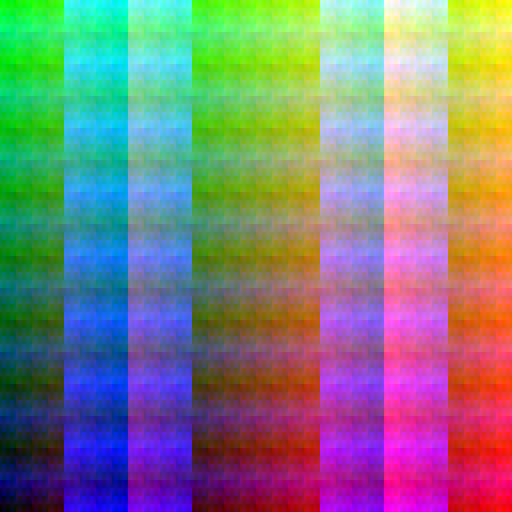
A space-filling curve is a fractal which, taken to infinite detail, passes through every point of some region. Hilbert's curve is one such which sweeps a square, or a cube (or hypercube); unlike some, it has the appealing property (of which this chart takes advantage) that any continuous stretch of the curve sweeps a compact region.
Imagine dividing a cube (representing the gamut of colors) into 256×256×256 beads, and running a thread along a twisty path so that it passes through each bead. Then pull the threaded beads out of the cube, and lay them down in a similar twisty path in a square, 4096×4096.
I used Steve Witham's Python code.
Big version (.png.gz, 3.4 MB)
Reload the page to see another of 24 color schemes.
A pattern on the hyperbolic plane, based on three mirrors whose mutual angles are π/7, π/3, π/2. To show it on the Euclidean plane of the page, I use a mapping analogous to Mercator's. (The mapping in Escher's Circle Limit series is analogous to stereographic projection.)
For years I was frustrated in hunting for the formulas I needed for this. In 2008 I found them (except for the Mercator gimmick, my own idea) in Euclidean and non-Euclidean geometry: An analytic approach (1986) by Patrick J. Ryan.
As I was working on my program, I thought I'd better confirm the Mercator formula – but could not remember or reconstruct how I had derived it so long ago. So I derived it in a new way, using what I had recently learned from Ryan's book, and was relieved to get the same answer.
I showed this to Vladimir Bulatov, who extended the concept in ways I could not imagine. And now (2020) people are calling it the “Bulatov band”, although VB showed me prior art.
My Zazzle store includes several variants of this design.
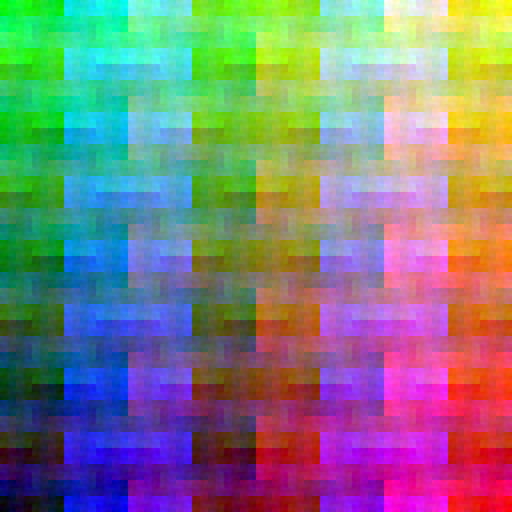
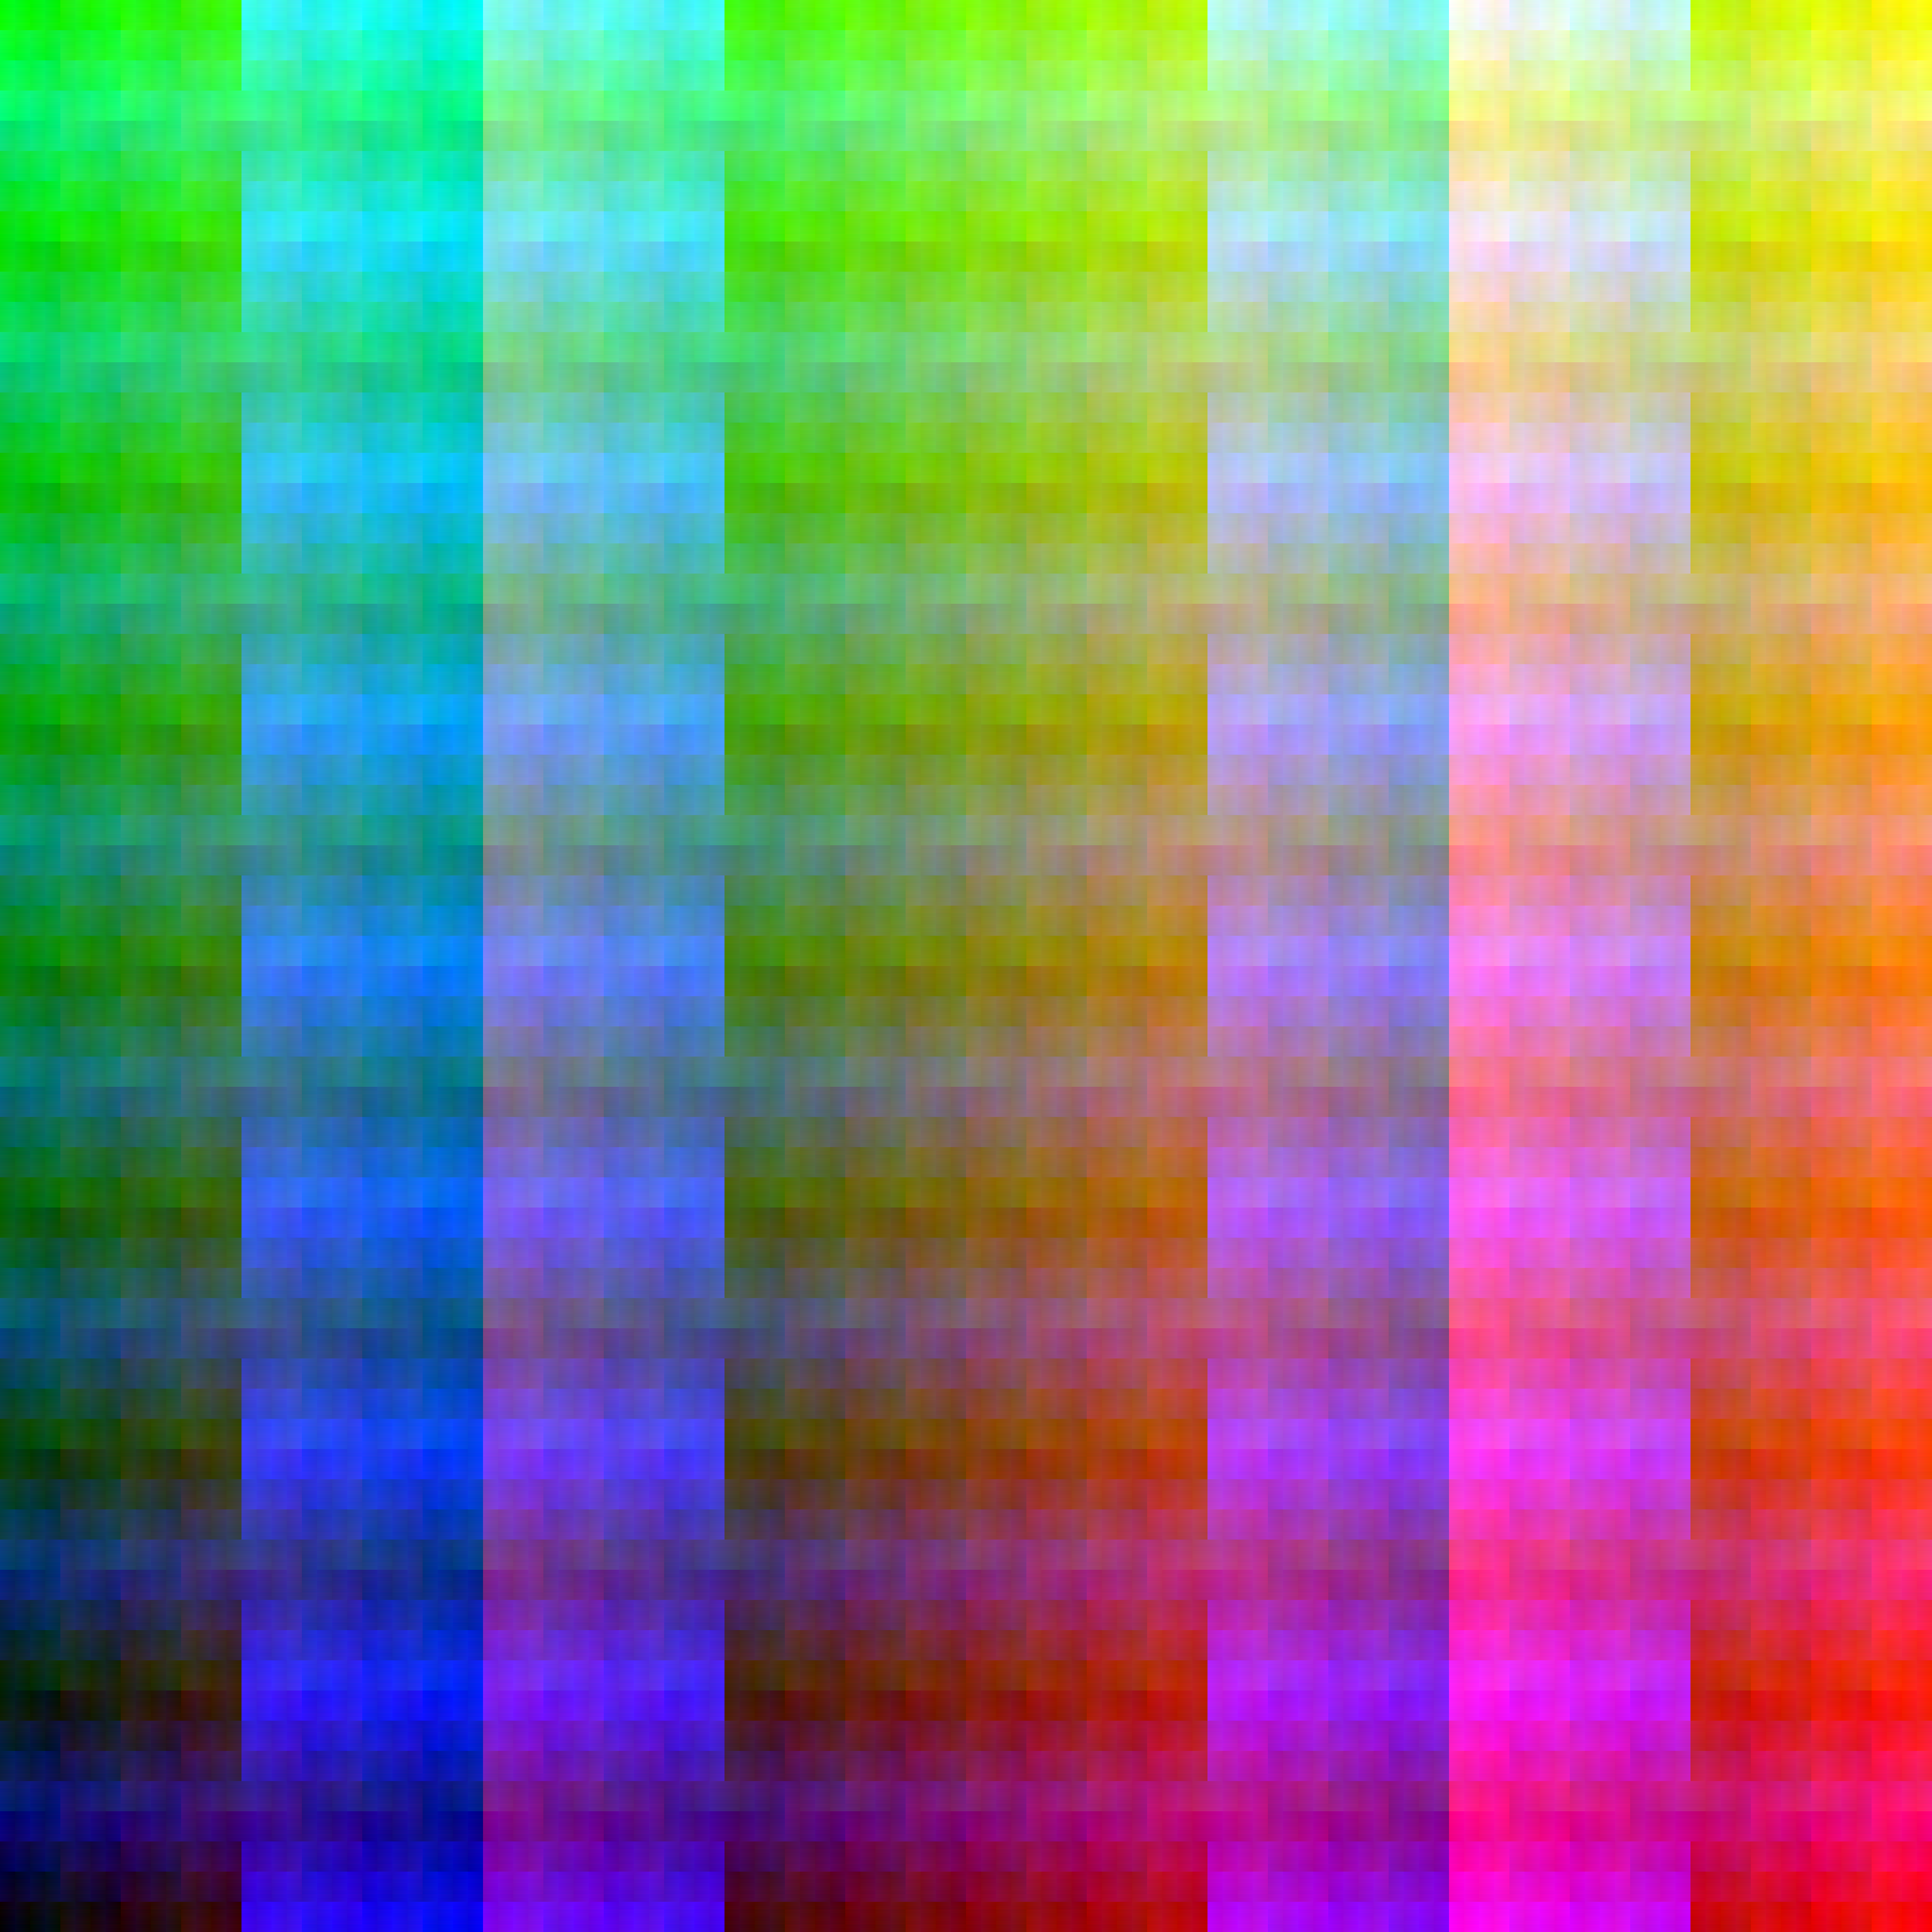
The coordinates of each pixel are expressed in Gray code; each bit is assigned to one of the color channels, and the composite is converted back from Gray code to ordinary binary. (Omitting the Gray step gives a boring array of strictly nested rectangles.) Big version, 4096×4096.
The assignment of the bits can of course be done in a wide variety of ways; in this example the rule is R = X11 X10 Y8 X7 Y5 X4 Y2 Y0, G = Y11 Y10 Y9 X8 Y6 X5 Y3 Y1, B = X9 Y7 X6 Y4 X3 X2 X1 X0. With some swaps between x and y, the same sequence gives a very different appearance: 512, 4096.
As in the Hilbert design (above) and the dragon design (below), the full-size pattern includes all the colors of the RGB gamut.
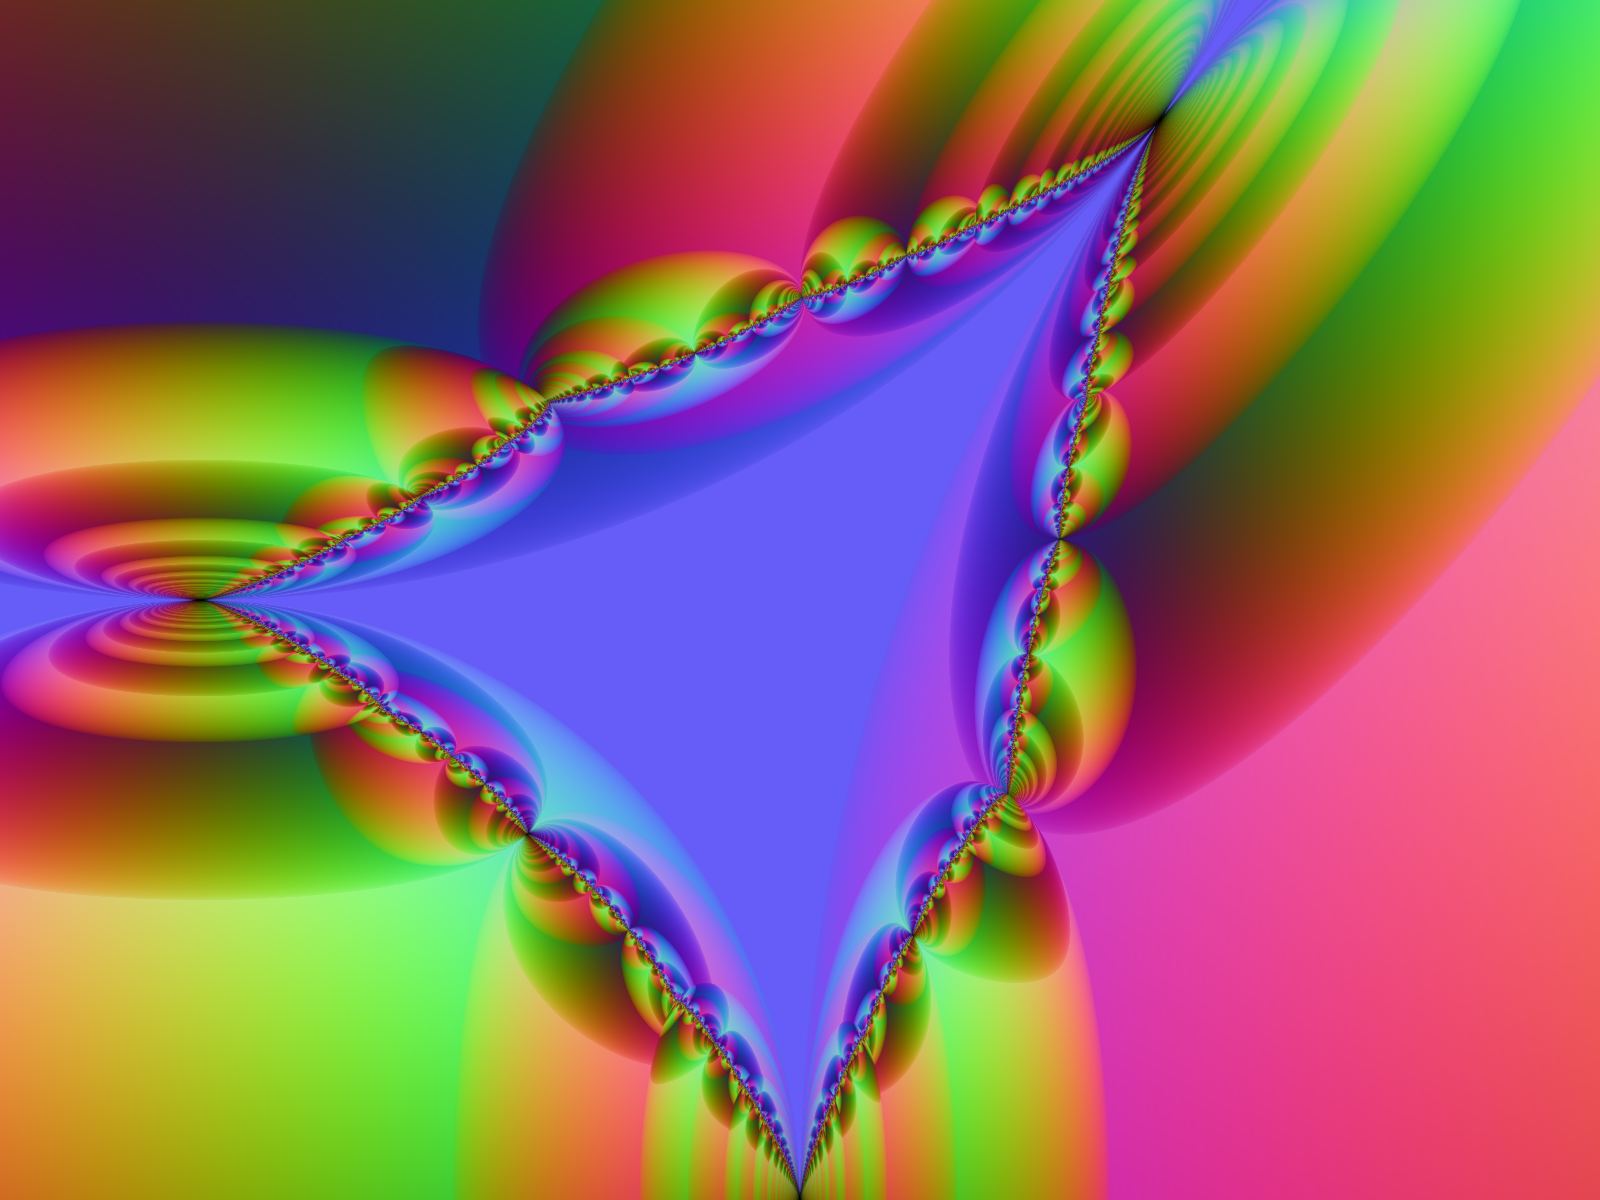
You may know from The Art of Computer Programming §4.1 (citing W. Penney, 1965) that, just as any positive real number can be represented by a bit string in base 2, any complex number can be represented by a bit string in base −1+i. Here I express the bits of that representation as bits of color values.
The radix need not be the same at each place; for analogy consider time notation, with radices 60, 60, 24. Here are 24 examples of the results of mixing −1+i and −1−i.
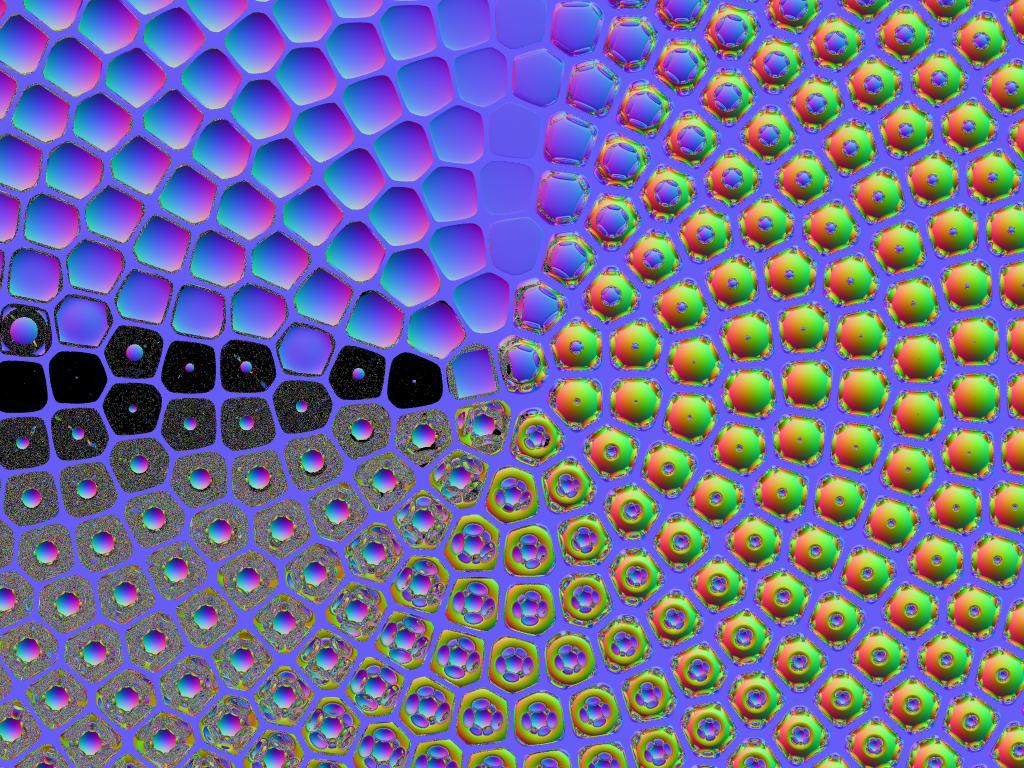
Some but not all of the 28 convex uniform tilings of Euclidean 3space can be generated with mirrors. This one is called runcitruncated cubic: it consists of truncated cubes, octagonal prisms, square prisms and small rhombicuboctahedra.
You're looking at three luminous cylinders and four imperfect mirrors (they reflect about 46/47 of the incident light).
I made a set of similar pictures for Wikipedia. I'd love to do the same for curved spaces (where there are many more such patterns) but I'd need to write a non-Euclidean ray tracer and I would hardly know how to begin doing that.
Each bead's index of refraction is tan(θ/2). I had believed that negative indices (the lower half of the picture) could not exist, but after making this I heard that a substance has been found that negatively refracts radio waves. This is interesting because a substance of negative index can be used to make a "perfect lens", meaning (if I understand right) without spherical aberration.
Centers of the beads: for each half-integer t, r = √(t/π); u = √(4πt-1); θ = u-atan(u). The number of bead-centers within r of the origin is thus πr², and the distance (along the smooth curve) between bead-centers is always 1. (I have tried and failed to find a spherical curve with analogous properties.)
The beads are modified spheres: slightly prolate (stretched) in the line of sight because that gives some of the beads a more interesting appearance; and smoothly flattened to fill more of the plane without intersecting, using Tor Olav Kristensen's "antiblob" idea (though not his code).
Bigger version (1.5MB)My Zazzle store includes a version of this design.
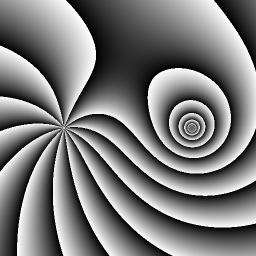
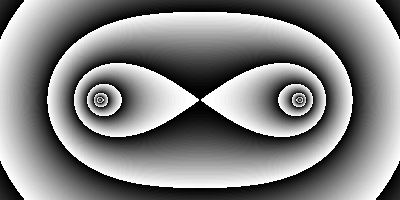
Contours of the real part of the complex function log(z-1) + i log(z+1); in other words, streamlines of a sink (or source) beside a pure vortex.

Kissing spheres: twelve reflective around one luminous.
(512×512 PNG, 188K; 1024×1024 JPEG, 86K)
(Three unequal spheres, 1600×1200 JPG, 122K)
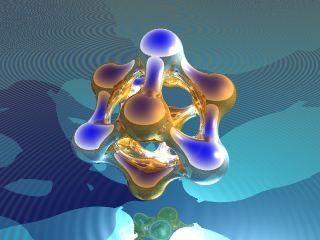
Each atom in a diamond crystal is bonded to four neighbors. Games of go played on such a lattice ought to be similar in some ways to games played on a standard board - unlike on a board tiled with triangles, for instance.
Fritz Obermeyer's Jenn makes go-boards in positively curved 3-space (see bottom of page).
If you have access to an academic library, you can see this blown up to a full page in Physics World, December 2005, page 25.
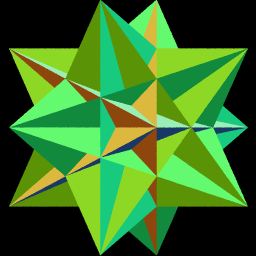
Nothing particularly original here, just testing a couple of new PoV-Ray features; using the great icosahedron because it's pretty.
I took the liberty of naming the pigment “Tufte”: it uses unsaturated colors to represent, in a ‘natural’ way, the orientation of the planes.
You may recognize this image from my use of it (or a version with a different viewpoint) as my icon on Gravatar, Twitter, Mastodon et cetera.
The “Druidic Pentagram” – described in a posting by Tommy the Terrorist to rec.arts.sf.science, 2000 Mar 20 – is a zigzag loop joining the 20 vertices of a dodecahedron.
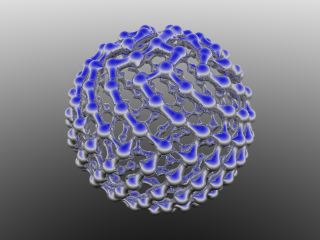
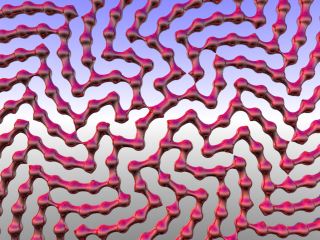
I used Surface Evolver to make a soap-film on it, and then wrote a crude Python program to translate that to a PoV-Ray mesh. (It is not a ‘proper’ soap-film, of course; real ones don't intersect at arbitrary angles.)
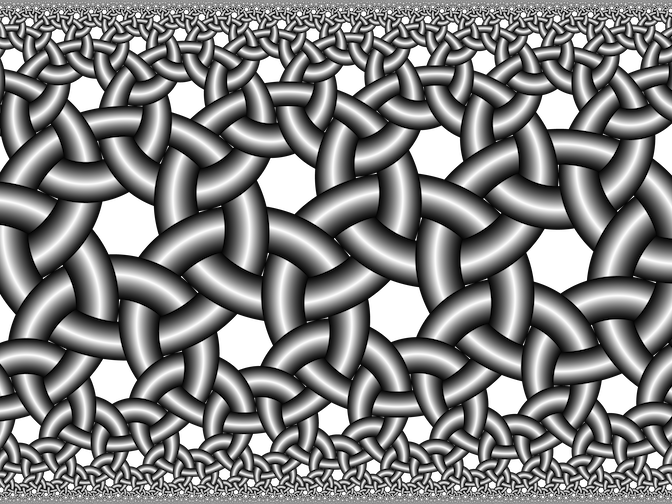
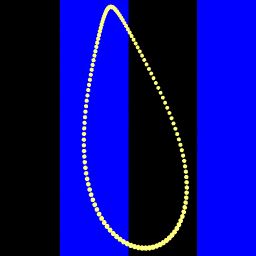
The (3,4)-torus knot, rendered with an experimental texture.
The most famous curve of constant width, after the circle, is the Reuleaux triangle.
But such curves can be built on any set of lines in the plane, provided that no two are parallel. Here is one built on a 2:3:4 triangle, the smallest scalene triangle with integer sides. Note how each arc of the circumference corresponds to an opposite arc with the same center. (One such arc has zero radius.) The sum of the radii of opposite arcs is constant, in this case 5 units.
To make the arcs' centers obvious, I built this figure from wedges of five cones.
Contours of the gravity-field of 200 point-masses equally spaced on a circle.
This was provoked by a discussion of “Gravity on Planet Donut” on the Straight Dope site.
If a camera on Mars is exposed to the sun every few days at mean noon, a year's worth of exposures should look like this. (Another simulation.)
The shape of the analemma depends mainly on the angle between the line of apsides and the line of solstices. (See more examples.)
The stripes are one hour wide, or rather 1/24 day.
Photograph of Earth's analemma
An equal-area mapping of the red spiral (below) onto a sphere.
Such a design, cast in silver, could make a pretty desk-ornament.
The nodes are arranged as seeds in a sunflower, according to the rule r = √(n+½), θ = n*(2*π/τ), where τ (tau) is the golden ratio. (Learn more.) Because successive nodes in this spiral are so far apart (138 degrees), the eye finds more obvious spirals; this is a form of aliasing. (Kevin Brown discusses a similar effect.) Here the nodes are united in a “blob” which forms bridges between the nearest nodes, emphasizing the artifact arcs.
The golden ratio is also called Φ (Phi), but I prefer τ because φ (phi) also stands for co-latitude in spherical coordinates. Both are relevant in the item immediately above this one.
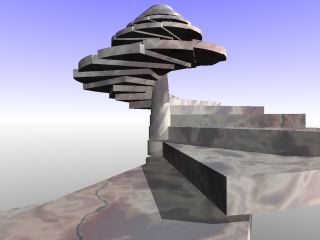
A fantasy of mine is to build a castle with a conspicuous staircase, opening to the outside but with no other doors. The stair would converge to a point near the top of the castle wall; seen from below, it should appear to rise forever. I call it my Tourist Trap.
The turns of the snail shell (below) are proportional to kn; those of this stairway are proportional to 1/n.
Someone found this page by asking "what are the gaps at the top of a castle wall called?" The answer is crenels or embrasures. The solid projections are merlons; the pattern is collectively called battlements.
A sequence of rings illustrating exponential growth.
My first original PoV-Ray scene, slightly altered (the original was too dark): a rhombic dodecahedron of “blobs”.
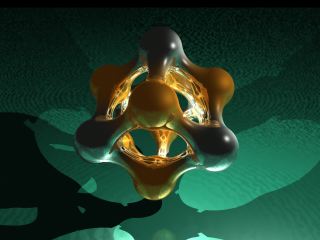
The "silver" nodes are at the corners of an octahedron, and the "gold" nodes at the corners of a cube; my main motive in making this was to see how the textures would blend between the nodes.